Directional limits on persistent gravitational waves from Advanced LIGO's first observing run
Notebook to re-create plots from the publication available at arXiv:1612.02030
Contents
General Definitions
% define power law index values
alpha = [0 2 3];

% strings for printing units
str1 = '[strain^2 Hz^{-1}]';
str2 = '[strain^2 Hz^{-1} sr^{-1}]';
ergs1 = '[ergs cm^{-2} s^{-1} Hz^{-1}]';
ergs2 = '[ergs cm^{-2} s^{-1} Hz^{-1} sr^{-1}]';
Figure 1 - Braodband Radiometer (BBR) skymaps
% Plot SNR maps
for a = 1:length(alpha);

    astr(a) = num2str(alpha(a));

    % correct numeric value for alpha = 2/3
    alph = alpha(a);
    switch alph
      case 2
        alph = 2/3;
        %fprintf('set alpha = %0.2f\n',alph)
      otherwise
        %fprintf('leave alpha = %0.2f\n',alph)
    end

    % load in data from data files
    radstr = ['fig1_bbr_a' astr(a)];
    raddat = load([radstr '.dat']);
    radmat.snr = raddat(:,1);

    % plot SNR maps
    plotMapAitoff(radmat.snr,360,181,-1);              % snr plot
    colorbar('FontSize',25);
    set(gcf,'renderer', 'zbuffer');
    set(gca, 'position', [0.12 0.15 .76 1]);
    print('-dpng',['fig1_bbr_SNR_a' astr(a) '.png']);
    title(['BBR SNR Map, \alpha=' num2str(alph)], 'FontSize', 14);

end

% Plot upper limit maps
for a = 1:length(alpha);

    astr(a) = num2str(alpha(a));

    % correct numeric value for alpha = 2/3
    alph = alpha(a);
    switch alph
      case 2
        alph = 2/3;
        %fprintf('set alpha = %0.2f\n',alph)
      otherwise
        %fprintf('leave alpha = %0.2f\n',alph)
    end

    % load in data from data files
    radstr = ['fig1_bbr_a' astr(a)];
    raddat = load([radstr '.dat']);
    radmat.ul_flux = raddat(:,2);

    %plot UL flux map
    plotMapAitoff(radmat.ul_flux,360,181,-1);          % flux upper limit map
    colorbar('FontSize',25);
    set(gcf,'renderer', 'zbuffer');
    set(gca, 'position', [0.1 0.15 .7 1]);
    print('-dpng',['fig1_bbr_UL_a' astr(a) '.png']);
    title(['BBR flux UL Map, \alpha=' num2str(alph)], 'FontSize', 14);

end
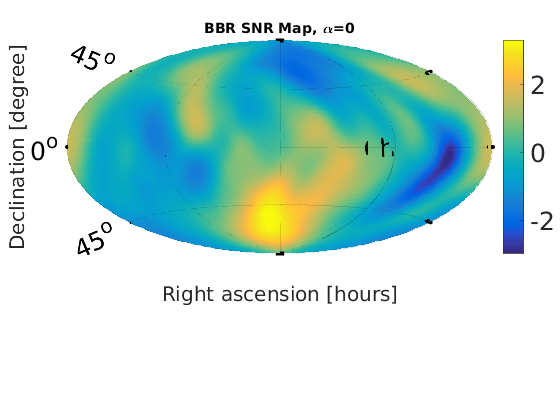
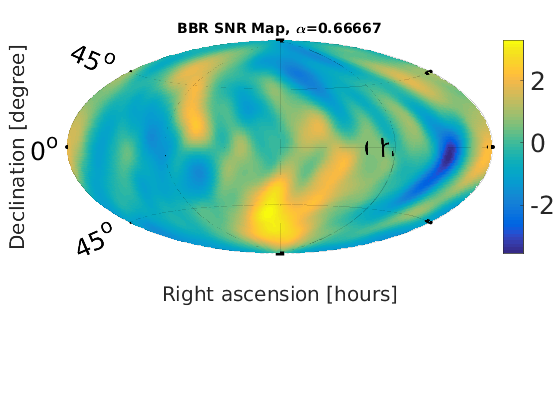
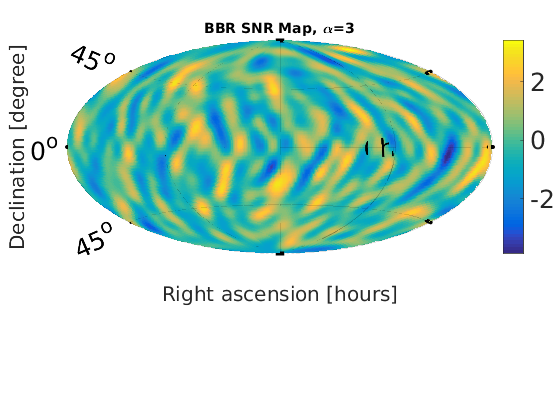
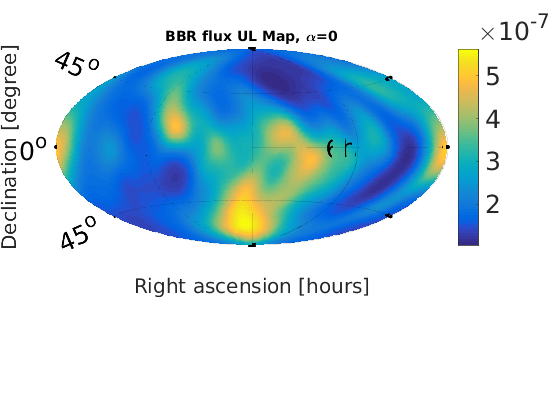
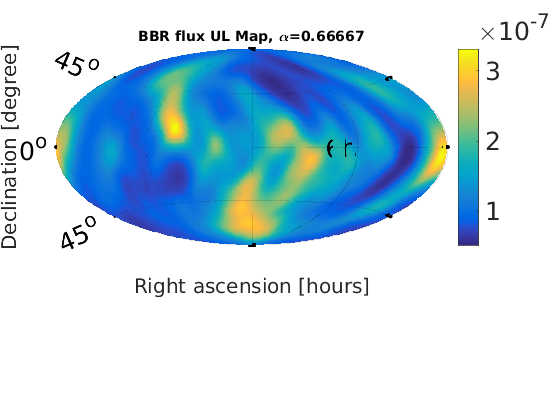
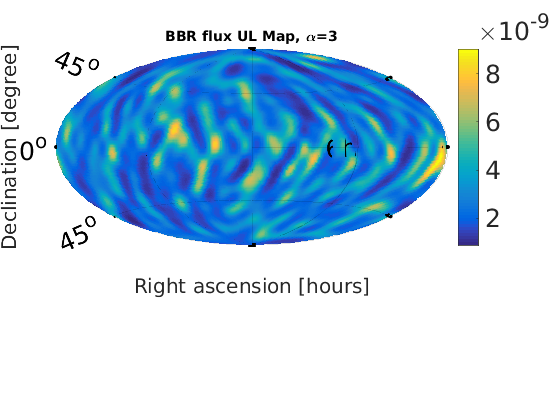
Figure 2 - Spherical Harmonic Decomposition (SHD) skymaps
% Plot SNR maps
for a = 1:length(alpha);

    astr(a) = num2str(alpha(a));

    % correct numeric value for alpha = 2/3
    alph = alpha(a);
    switch alph
      case 2
        alph = 2/3;
        %fprintf('set alpha = %0.2f\n',alph)
      otherwise
        %fprintf('leave alpha = %0.2f\n',alph)
    end

    % load in data from data files
    sphstr = ['fig2_shd_a' astr(a)];
    sphdat = load([sphstr '.dat']);
    sphmat.snr = sphdat(:,1);

    % plot SNR map
    plotMapAitoff(sphmat.snr,360,181,-1);     % SNR plot
    colorbar('FontSize',25);
    set(gcf,'renderer', 'zbuffer');
    set(gca, 'position', [0.12 0.15 .76 1]);
    print('-dpng',['fig2_shd_SNR_a' astr(a) '.png']);
    title(['SHD SNR map, $\alpha$=', num2str(alph)], 'FontSize', 14);

end

% Plot upper limit maps
for a = 1:length(alpha);

    astr(a) = num2str(alpha(a));

    % correct numeric value for alpha = 2/3
    alph = alpha(a);
    switch alph
      case 2
        alph = 2/3;
        %fprintf('set alpha = %0.2f\n',alph)
      otherwise
        %fprintf('leave alpha = %0.2f\n',alph)
    end

    % load in data from data files
    sphstr = ['fig2_shd_a' astr(a)];
    sphdat = load([sphstr '.dat']);
    sphmat.ul_omega = sphdat(:,2);

    % plot omega UL map
    plotMapAitoff(sphmat.ul_omega,360,181,-1);                   % energy density upper limit plot
    colorbar('FontSize',25);
    set(gcf,'renderer', 'zbuffer');
    set(gca, 'position', [0.1 0.15 .7 1]);
    print('-dpng',['fig2_shd_UL_a' astr(a) '.png']);
    title(['SHD UL map \alpha=', num2str(alph)], 'FontSize', 14);

end
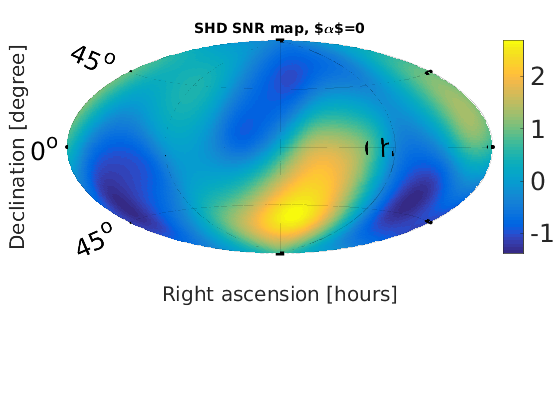
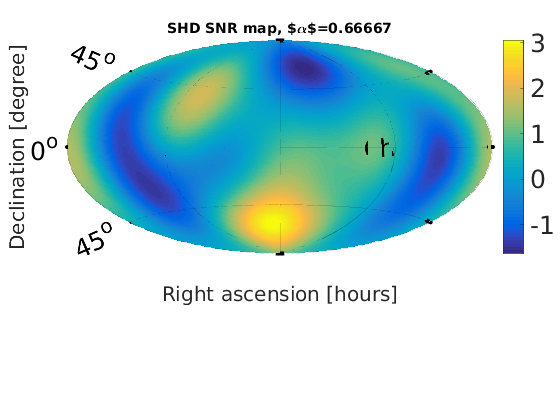
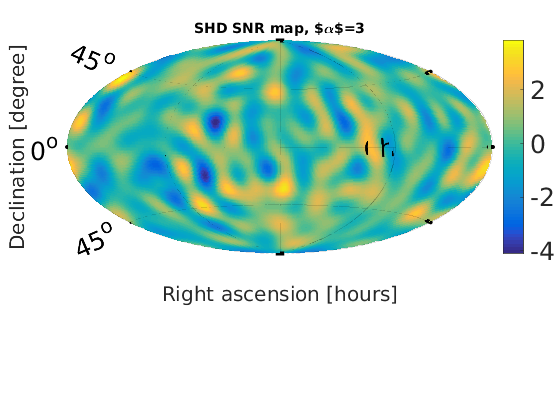
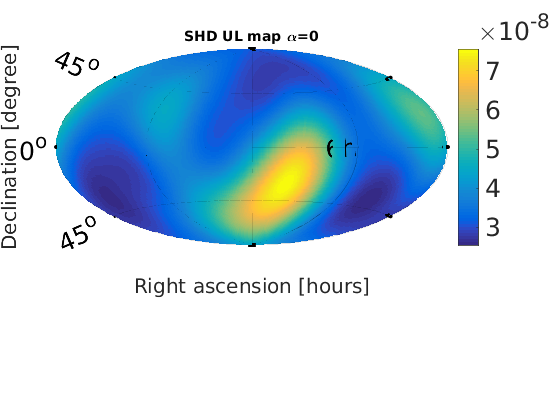
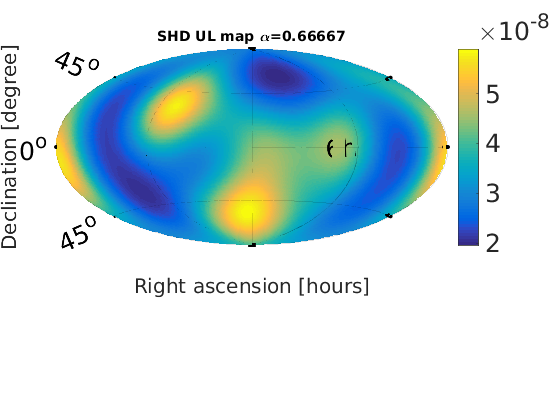
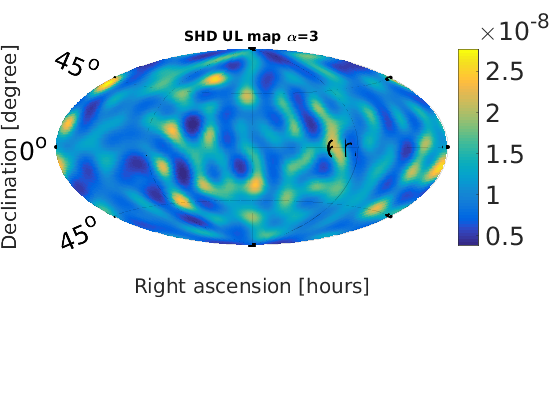
Figure 3 - Angular power (Cl) upper limits
matstr1 = 'fig3_Cls_a';
matstr2 = '.dat';
matstr3 = '.mat';

% load a0 and a3 data for limits
cl0 = load([matstr1 '0' matstr3]);
cl3 = load([matstr1 '3' matstr3]);

% define draw arrow function
drawArrow = @(x,y,varargin) quiver( x(1),y(1),x(2)-x(1),y(2)-y(1),0, varargin{:} );


% start figure
figure('units','normalized','position',[0 0 1 .3])

% load alpha = 0
a=1;
clstr = [matstr1 astr(a)];
load([clstr matstr3]);
cldat = load([clstr matstr2]);
clear('x1'); x1 = cldat(:,1);
clear('y1'); y1 = cldat(:,2);
% plot alpha = 0
p0 = semilogy(x1, y1,'o', 'MarkerSize', 10); hold on;
% draw upper limit arrow for each l
for j=1:length(y1)
drawArrow([x1(j) x1(j)], [cl3.y0(j) y1(j)], 'kv', 'MarkerFaceColor', p0.Color)
end


% load alpha = 2/3 data
a=2;
clstr = [matstr1 astr(a)];
load([clstr matstr3]);
cldat = load([clstr matstr2]);
clear('x1'); x1 = cldat(:,1);
clear('y1'); y1 = cldat(:,2);
% plot alpha = 2/3 data
p2 = semilogy(x1, y1,'o', 'MarkerSize', 10, 'Color', [0.8500    0.3250    0.0980]); hold on;
% draw upper limit arrow for each l
for j=1:length(y1)
drawArrow([x1(j) x1(j)], [cl3.y0(j) y1(j)], 'kv', 'MarkerFaceColor', p2.Color)
end


% load alpha = 3 data
a=3;
clstr = [matstr1 astr(a)];
load([clstr matstr3]);
cldat = load([clstr matstr2]);
clear('x1'); x1 = cldat(:,1);
clear('y1'); y1 = cldat(:,2);
% plot alpha = 3 data
p3 = semilogy(x1, y1,'o', 'MarkerSize', 10); hold on;
% draw upper limit arrow for each l
for j=1:length(y1)
drawArrow([x1(j) x1(j)], [cl3.y0(j) y1(j)], 'kv', 'MarkerFaceColor', 'w') ;%p3.Color)
end


% set axis limits and labels
xlim([-0.5 xmax+0.5]); ylim([ymin ymax]);
ylim([cl3.ymin cl0.ymax]);
grid on
xlabel('$l$', 'Interpreter','latex','FontSize',34);
%ylabel('$C_l^{1/2}$ [Energy Density]', 'Interpreter','latex','FontSize',28);
ylabel('$C_l^{1/2}$ [$\Omega_{gw}$ sr${}^{-1}$]', 'Interpreter','latex', 'FontSize',34);
%set(gca, 'OuterPosition', [0 0 1 1]);
pretty2(32,20);
fig=gcf; %fig.PaperUnits = 'normalized'; fig.PaperPosition = [0 0 .9 .6];
fig.PaperUnits = 'inches';
fig.PaperPosition = [0 0 15 5];
% set legend
legend([p0 p2 p3], '\alpha=0', '\alpha=^2/_3', '\alpha=3')
legend('BoxOff')

% save to file
print('-dpng', ['fig3_ClULs.png'], '-r0');

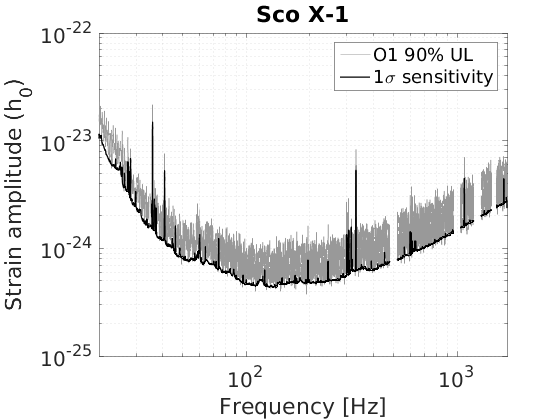
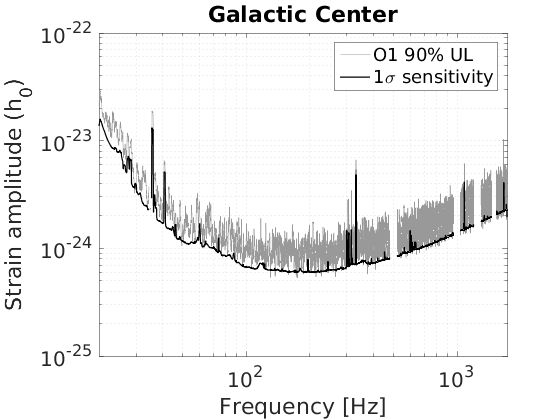
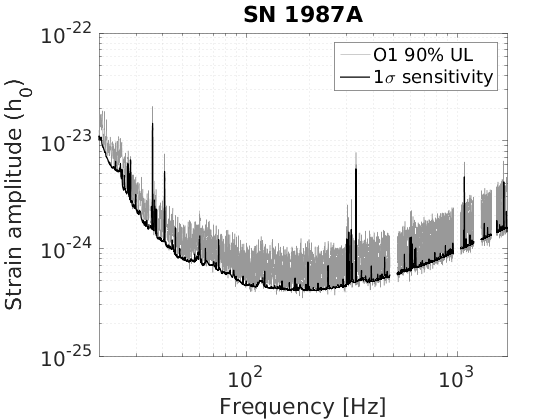
Figure 4 - Narrowband Radiometer (NBR) upper limits
matstr = 'fig4_nbr_';

% Scorpius X-1
    nbstr = 'sco';
    clear('nbdat');
    nbdat = load([matstr nbstr '.dat']);
    nbmat.f = nbdat(:,1);
    nbmat.ul = nbdat(:,2);
    nbmat.one_sigma = nbdat(:,3);
    nbmat.conf = 0.9;
    % make strain amplitude UL plot
    figure; %('units','normalized','position',[0 0 1 0.3]);
    loglog(nbmat.f, nbmat.ul,'Color',[0.6 0.6 0.6]); hold on;
    loglog(nbmat.f, nbmat.one_sigma,'k','LineWidth', 1.2);
    pretty;
    grid minor;
    xlabel('Frequency [Hz]');
    ylabel('Strain amplitude (h_0)');
    title('Sco X-1');
    legend({['O1 ' num2str((nbmat.conf)*100) '% UL'], '1\sigma sensitivity'});
    xlim([min(nbmat.f),max(nbmat.f)]);
    print('-dpng',['fig4_' nbstr]);


 % Galactic Center
    nbstr = 'gc';
    clear('nbdat');
    nbdat = load([matstr nbstr '.dat']);
    nbmat.f = nbdat(:,1);
    nbmat.ul = nbdat(:,2);
    nbmat.one_sigma=nbdat(:,3);
    nbmat.conf = 0.9;
    % make strain amplitude UL plot
    figure; %('units','normalized','position',[0 0 1 0.3]);
    loglog(nbmat.f, nbmat.ul,'Color',[0.6 0.6 0.6]); hold on;
    loglog(nbmat.f, nbmat.one_sigma,'k','LineWidth', 1.2);
    pretty;
    grid minor;
    xlabel('Frequency [Hz]');
    ylabel('Strain amplitude (h_0)');
    title('Galactic Center');
    legend({['O1 ' num2str((nbmat.conf)*100) '% UL'], '1\sigma sensitivity'});
    xlim([min(nbmat.f),max(nbmat.f)]);
    print('-dpng',['fig4_' nbstr]);


 % Supernova 1987A
    nbstr = 'sn';
    clear('nbdat');
    nbdat = load([matstr nbstr '.dat']);
    nbmat.f = nbdat(:,1);
    nbmat.ul = nbdat(:,2);
    nbmat.one_sigma=nbdat(:,3);
    nbmat.conf = 0.9;
    % make strain amplitude UL plot
    figure; %('units','normalized','position',[0 0 1 0.3]);
    loglog(nbmat.f, nbmat.ul,'Color',[0.6 0.6 0.6]); hold on;
    loglog(nbmat.f, nbmat.one_sigma,'k','LineWidth', 1.2);
    pretty;
    grid minor;
    xlabel('Frequency [Hz]');
    ylabel('Strain amplitude (h_0)');
    title('SN 1987A');
    legend({['O1 ' num2str((nbmat.conf)*100) '% UL'], '1\sigma sensitivity'});
    xlim([min(nbmat.f),max(nbmat.f)]);
    print('-dpng',['fig4_' nbstr]);
